What you can do
This page documents the Data Warehouse Interface to the Old Bailey. This interface lets users create custom visualizations using the structured information in the database. For example, here you see a line of graphs that show the number of defendants whose punishment was transportation broken out by gender. To get this graph you choose Transportation under the Punishment drop-down menu, then you click the Show Subcategories checkbox by Defendant Gender and you to Count Defendants under Output. This graphs only those defendants who were punished with transportation, but it creates a different graph for each of the coded genders (Female, Indeterminate, Male and Punishment Missing). You actually get a matrix of many more graphs as there are different subcategories of transportation.
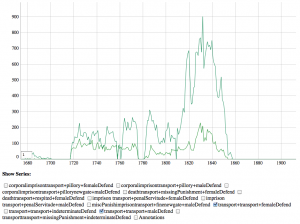
Alternatively you could ask for the same information, but choose a Dygraph for Output. This would give you a graph like this:
With this Output the graphs are superimposed and you can turn off and on the ones you want. You can ask if there are anomalies between the transportation of men and women.
Note that the labeling of the curves is a little cluttered and non-intuitive, this is something that will be remedied as the prototype advances.
How to use the Interface
The Data Warehouse Interface (DWI) is designed to let you explore the structured information in the Old Bailey database in combination with word searches. Generally the way to think through formulating a query is to do the following:
Choose a Filter: Ask if you want filter the full collection by some criteria. For example you may only be interested in certain date range or only in trials that resulted in a certain verdict.
Choose what you want to Show: By clicking the checkboxes next to the Filter Categories you can choose what you want graphed. Typically you don’t click a Subategory that you are filtering by. If you click to Show Verdicts you will a graph for each different verdict that is tagged in the database. If you choose to show two different Subcategories you will get a matrix of graphs corresponding to each combination. Thus if you choose Gender and Punishment you will get a graph for Female defendants and each of the Punishment categories, then you will get graphs for each combination of Male and Punishment and so on. These graphs can be compared in different ways. (You can also try the Output Dygraph to get them superimposed.)
Filtering by Words: You can also filter by words so you can choose to Output a graph with all the trials that contain a word like “adultery.” There are a number of options for filtering and tracking words that are explained in the documentation to the right of the choices.
Output: Finally you choose the type of Output you want. You can get a matrix of graphs or a superimposed graph. We are experimenting with outputs that show you word lists.
To learn more about data warehousing see the Wikipedia article.


